Quickstart
Install:
pip install git+https://github.com/matomatical/matthewplotlib.gitImport the library:
import matthewplotlib as mpConstruct a plot:
import numpy as np

xs = np.linspace(-2*np.pi, +2*np.pi, 156)

plot = mp.axes(
    mp.scatter(
        (xs, 1.0 * np.cos(xs), "red"),
        (xs, 0.9 * np.cos(xs - 0.33 * np.pi), "magenta"),
        (xs, 0.8 * np.cos(xs - 0.66 * np.pi), "blue"),
        (xs, 0.7 * np.cos(xs - 1.00 * np.pi), "cyan"),
        (xs, 0.8 * np.cos(xs - 1.33 * np.pi), "green"),
        (xs, 0.9 * np.cos(xs - 1.66 * np.pi), "yellow"),
        width=75,
        height=10,
        yrange=(-1,1),
    ),
    title=" y = cos(x + 2πk/6) ",
    xlabel="x",
    ylabel="y",
)
Print to terminal:
print(plot)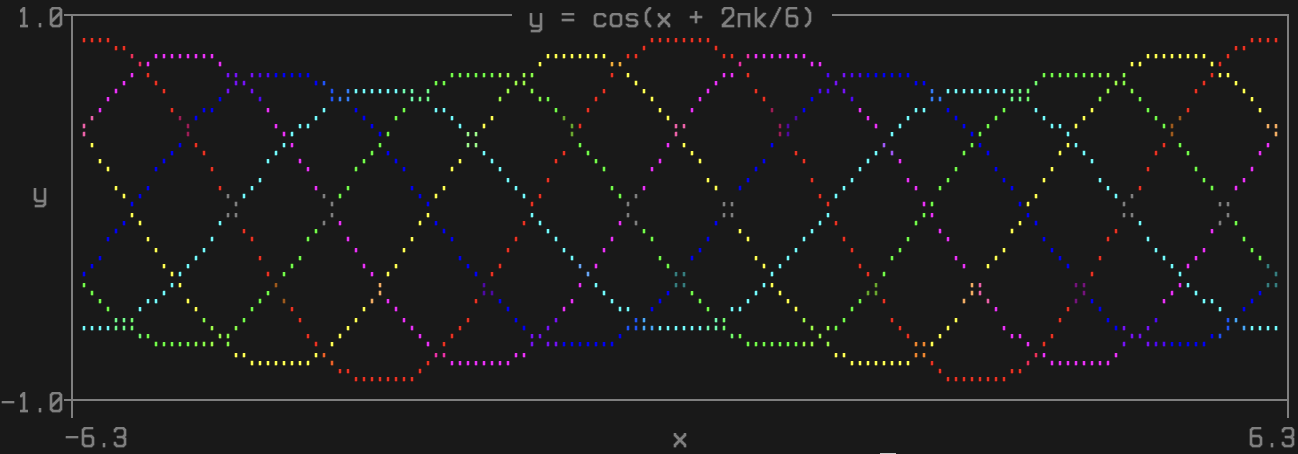
Export to PNG image:
plot.saveimg("images/quickstart.png")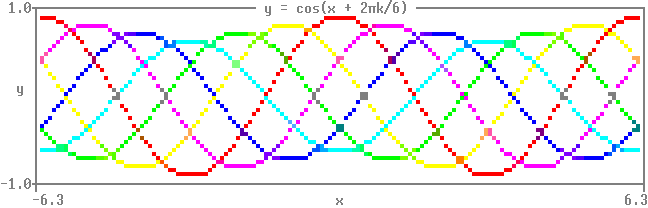
Animated version:
import time
import numpy as np
import matthewplotlib as mp

x = np.linspace(-2*np.pi, +2*np.pi, 150)

prev = None
while True:
    k = (time.time() % 3) * 2
    A = 0.85 + 0.15 * np.cos(k)
    y = A * np.cos(x - 2*np.pi*k/6)
    c = mp.rainbow(1-k/6)

    plot = mp.axes(
        mp.scatter(
            (x, y, c),
            width=75,
            height=10,
            yrange=(-1,1),
        ),
        title=f" y = {A:.2f} cos(x + 2π*{k:.2f}/6) ",
        xlabel="x",
        ylabel="y",
    )
    print(plot - prev)
    prev = plot

    time.sleep(1/20)
Subtracting the previous frame repaints only the cells that changed, which is far fewer bytes than redrawing the whole plot. On the first pass prev is None – there is nothing on screen yet – so the whole plot is drawn.
That loop is the whole mechanism, and it stays fully supported. But the parts of it that are about terminals rather than about plots can be handed over, which draws exactly the same animation:
with mp.animate(fps=20) as anim:
    while True:
        ...
        anim.update(plot)
animate keeps the previous frame for you, and sleeps off whatever is left of each frame’s budget rather than a flat 1/fps – so the time you spend computing a frame, and the time the library spends drawing it, both come out of the frame’s budget instead of being added to it.
A bare print inside an animated loop lands in the middle of the plot. Inside the block there is somewhere to put it instead, as a method or as a file:
with mp.animate(fps=20) as anim:
    for step in range(1000):
        anim.update(vis(params))
        if step % 100 == 0:
            anim.print(f"step {step}: loss {loss:.4f}")
            # or: print(..., file=anim.out), or logging.StreamHandler(anim.out)
Either way the line goes above the plot, and the plot carries on below it. To route prints from code that knows nothing about any of this – somebody else’s training loop – redirect stdout into anim.out for the block:
with mp.animate(fps=20) as anim, contextlib.redirect_stdout(anim.out):
    ...
Ask it to record=True and it keeps every frame, as an animation you can save:
with mp.animate(fps=20, record=True) as anim:
    ...
anim.frames.savegif("wave.gif")
print("wanted 20 fps, managed", anim.achieved_fps)
That recording is an mp.tstack, which is what an animation looks like as a value rather than as a loop – the third stacking operation, arranging plots in time where + and / arrange them across the screen. Build one directly, and slice it, map a furnishing over its frames, play it, or save it:
a = mp.tstack(*[frame(t) for t in np.linspace(0, 1, 60)], fps=30)

a.map(lambda p: mp.border(p, title=" diffusion ")).play(loop=True)
a[30:][::-1].savegif("backwards.gif")
If your frames are already an array, mp.animation is mp.image with a time axis, and skips the loop entirely:
mp.animation(field, colormap=mp.viridis, fps=30).play()   # float[t,h,w]
mp.animation(video).savegif("video.gif")                  # uint8[t,h,w,rgb]