matthewplotlib: Matthew’s plotting library
A Python plotting library that aspires to not be painful.
pip install git+https://github.com/matomatical/matthewplotlib.gitStatus: Work in progress. See roadmap. Currently, still generally painful, due to lack of generated documentation and lack of common plot types. However, for personal use, I’m already finding what limited functionality it does have delightful.
|
|
|
Key features:
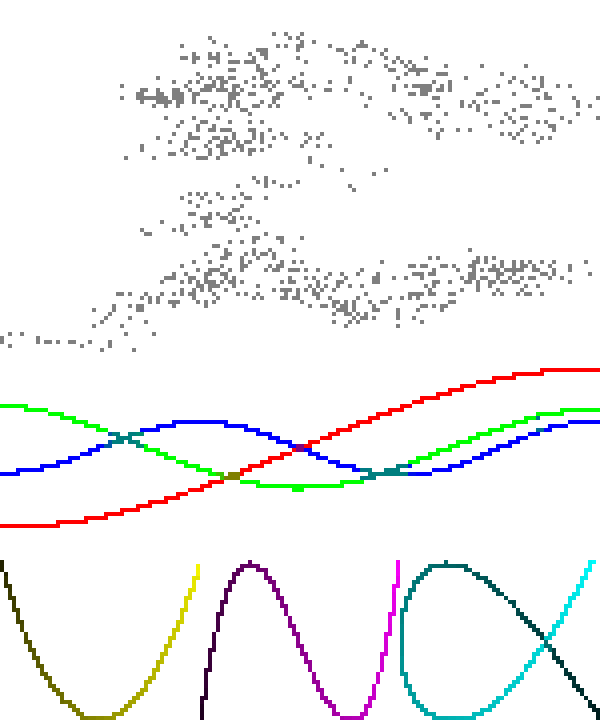
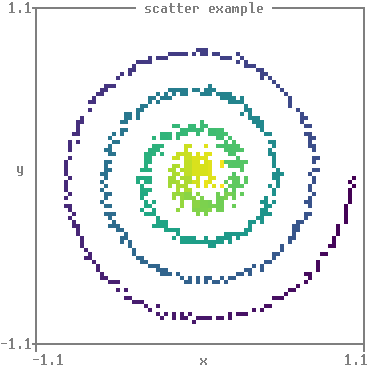
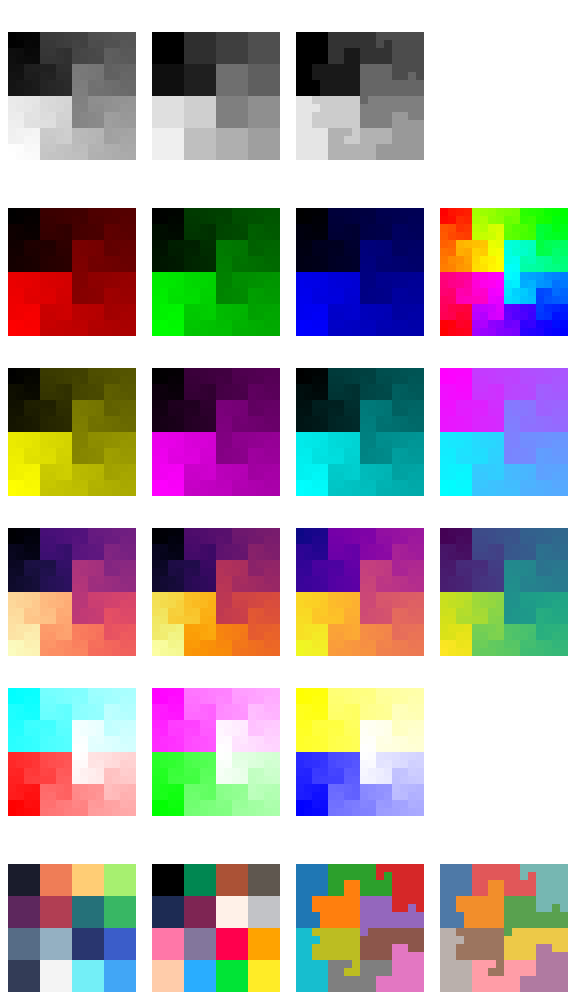
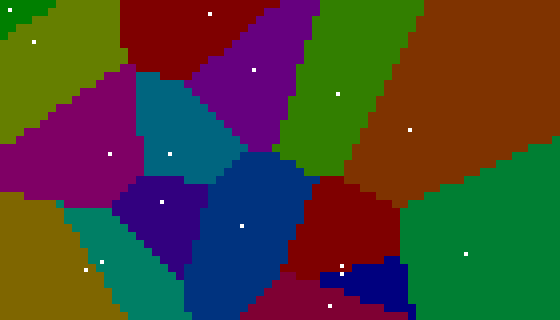
- Colourful unicode-based rendering of scatter plots, small images, heatmaps, bar charts, histograms, 3d plots, and more.
- Rendering plots to the terminal with
print(plot). No GUI windows to manage! - Plots are just expressions. Compose complex plots with horizontal (
+) and vertical (/) stacking operations, as insubplots = (plotA + plotB) / (plotC + plotD). - If you absolutely need plots outside the terminal, you can render them to PNG using a pixel font.
- In-place animated plots can be as simple as a loop of
print(new_plot - prev_plot). Or, we offer a context manager with an.update(new_plot)method and.print()for pass-through printing. - Animations support recording and saving to GIF, again using pixel fonts.
Rough edges:
- API for compositions not final.
- API for axes not final.
- No axes/labels available for bars/columns/histograms yet.
- Limited documentation.
- Limited input validation, error handling.
Documentation
- Quickstart and examples, with the source for the latter in
examples/. - API reference, generated from the docstrings. Each module opens with an overview of what is in it;
matthewplotlib.plotsis the place to start. - Roadmap, which is also the list of what to build next.
- Changelog.
Contributing
This is a personal project developed by MFR. It’s best to discuss with me before attempting to contribute, for example by raising an issue. Before that, please read the following.
Some notes on my coding/development style are in
CONTRIBUTING.md, please start there.Longer design notes and investigations live in
notes/. Seenotes/README.md.Ideas for new features live in the roadmap. Entries link to the note that covers them, so read that note before starting the work.