Quickstartdocs
Install:
pip install git+https://github.com/matomatical/matthewplotlib.git
Scatter plotsdocs
Import the library:
import matthewplotlib as mp
Construct a plot:
import numpy as np

xs = np.linspace(-2*np.pi, +2*np.pi, 156)

plot = mp.axes(
    mp.scatter(
        (xs, 1.0 * np.cos(xs), "red"),
        (xs, 0.9 * np.cos(xs - 0.33 * np.pi), "magenta"),
        (xs, 0.8 * np.cos(xs - 0.66 * np.pi), "blue"),
        (xs, 0.7 * np.cos(xs - 1.00 * np.pi), "cyan"),
        (xs, 0.8 * np.cos(xs - 1.33 * np.pi), "green"),
        (xs, 0.9 * np.cos(xs - 1.66 * np.pi), "yellow"),
        width=75,
        height=10,
        yrange=(-1,1),
    ),
    title=" y = cos(x + 2πk/6) ",
    xlabel="x",
    ylabel="y",
)
Print to terminal:
print(plot)
Result:
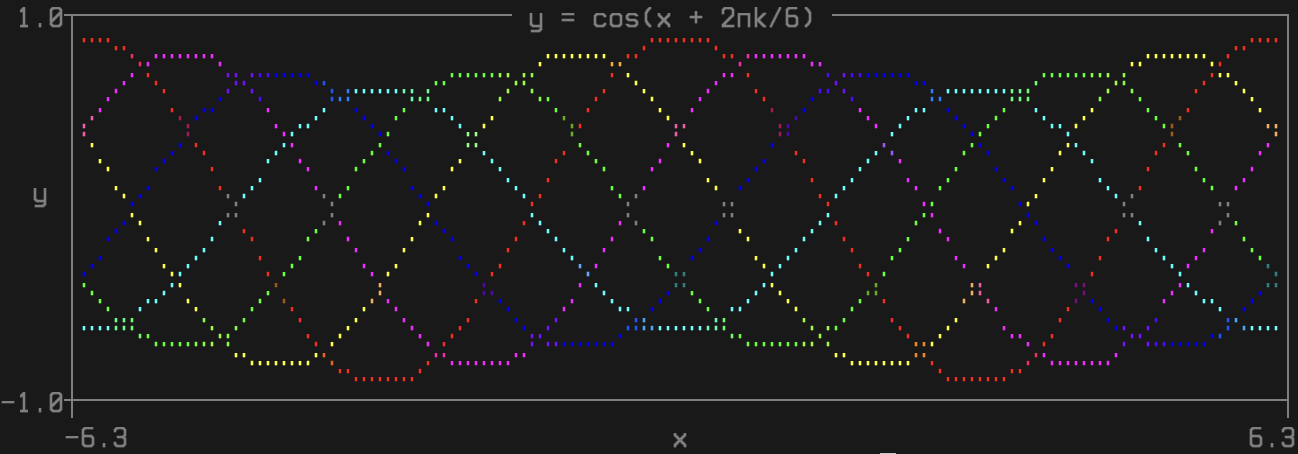
Export to PNG image:
plot.saveimg("images/quickstart.png")
Result:
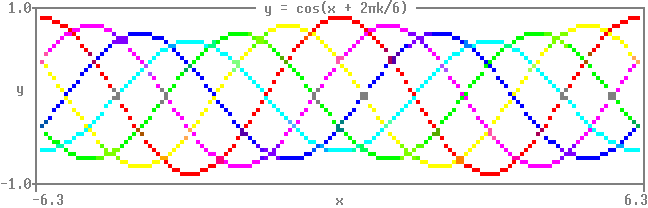
Animated scatter plotsdocs
Manual animation loop:
import time
import numpy as np
import matthewplotlib as mp

x = np.linspace(-2*np.pi, +2*np.pi, 150)

prev = None
while True:
    # construct the new frame's data
    k = (time.time() % 3) * 2
    A = 0.85 + 0.15 * np.cos(2*np.pi*k/6)
    y = A * np.cos(x - 2*np.pi*k/6)
    c = mp.rainbow(1-k/6)

    # construct the new frame's plot
    plot = mp.axes(
        mp.scatter(
            (x, y, c),
            width=75,
            height=10,
            yrange=(-1,1),
        ),
        title=f" y = {A:.2f} cos(x + 2π*{k:.2f}/6) ",
        xlabel="x",
        ylabel="y",
    )

    # print a string that overwrites the old plot with new
    print(plot - prev)
    prev = plot

    time.sleep(1/20)
Result:
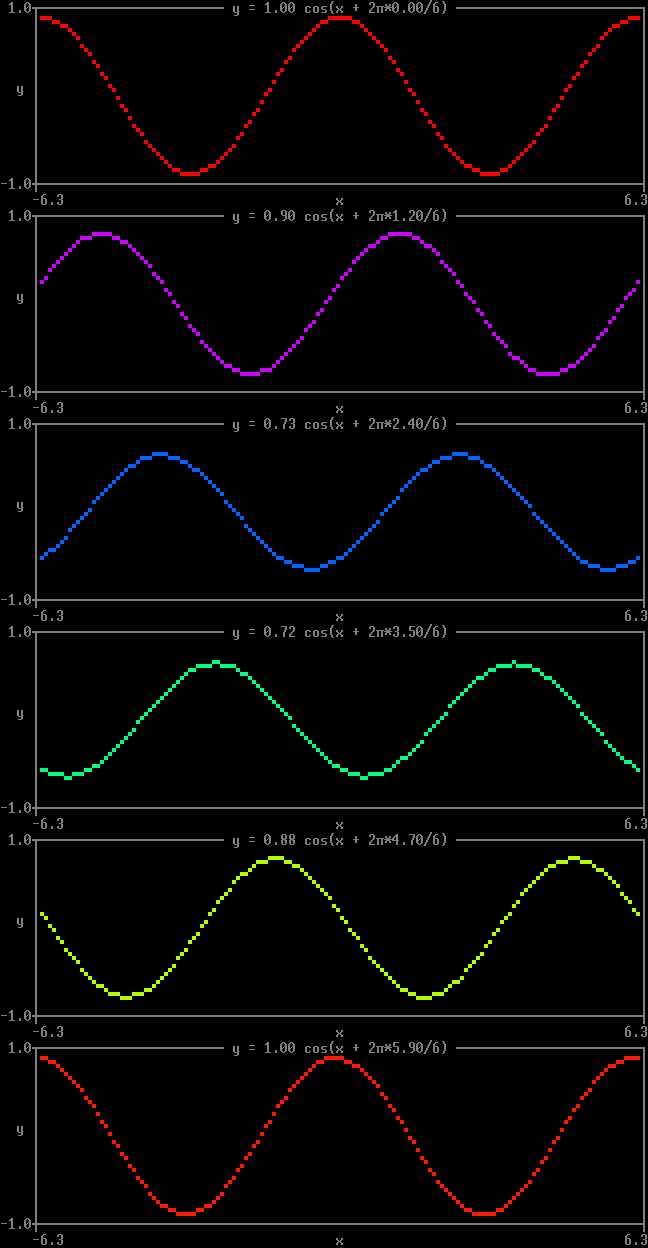
Alternatively, you can use the animation context manager:
import time
import numpy as np
import matthewplotlib as mp

x = np.linspace(-2*np.pi, +2*np.pi, 150)

with mp.animate(fps=20) as anim: # <- manages timing, printing
    while True:
        # construct the new frame's data
        k = (time.time() % 3) * 2
        A = 0.85 + 0.15 * np.cos(2*np.pi*k/6)
        y = A * np.cos(x - 2*np.pi*k/6)
        c = mp.rainbow(1-k/6)

        # construct the new frame's plot
        plot = mp.axes(
            mp.scatter(
                (x, y, c),
                width=75,
                height=10,
                yrange=(-1,1),
            ),
            title=f" y = {A:.2f} cos(x + 2π*{k:.2f}/6) ",
            xlabel="x",
            ylabel="y",
        )

        # update the animation
        anim.update(plot)
Result:
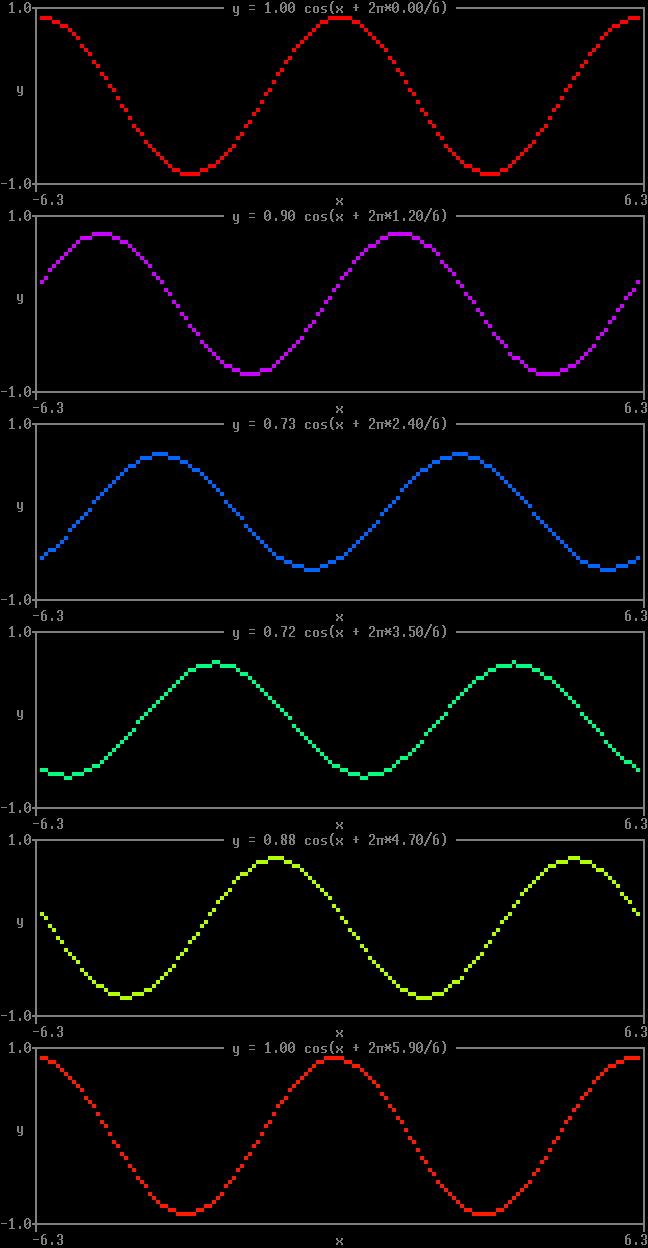
Next stepsdocs
See the examples or API reference.